Power BI
Click here to download the interactive report:
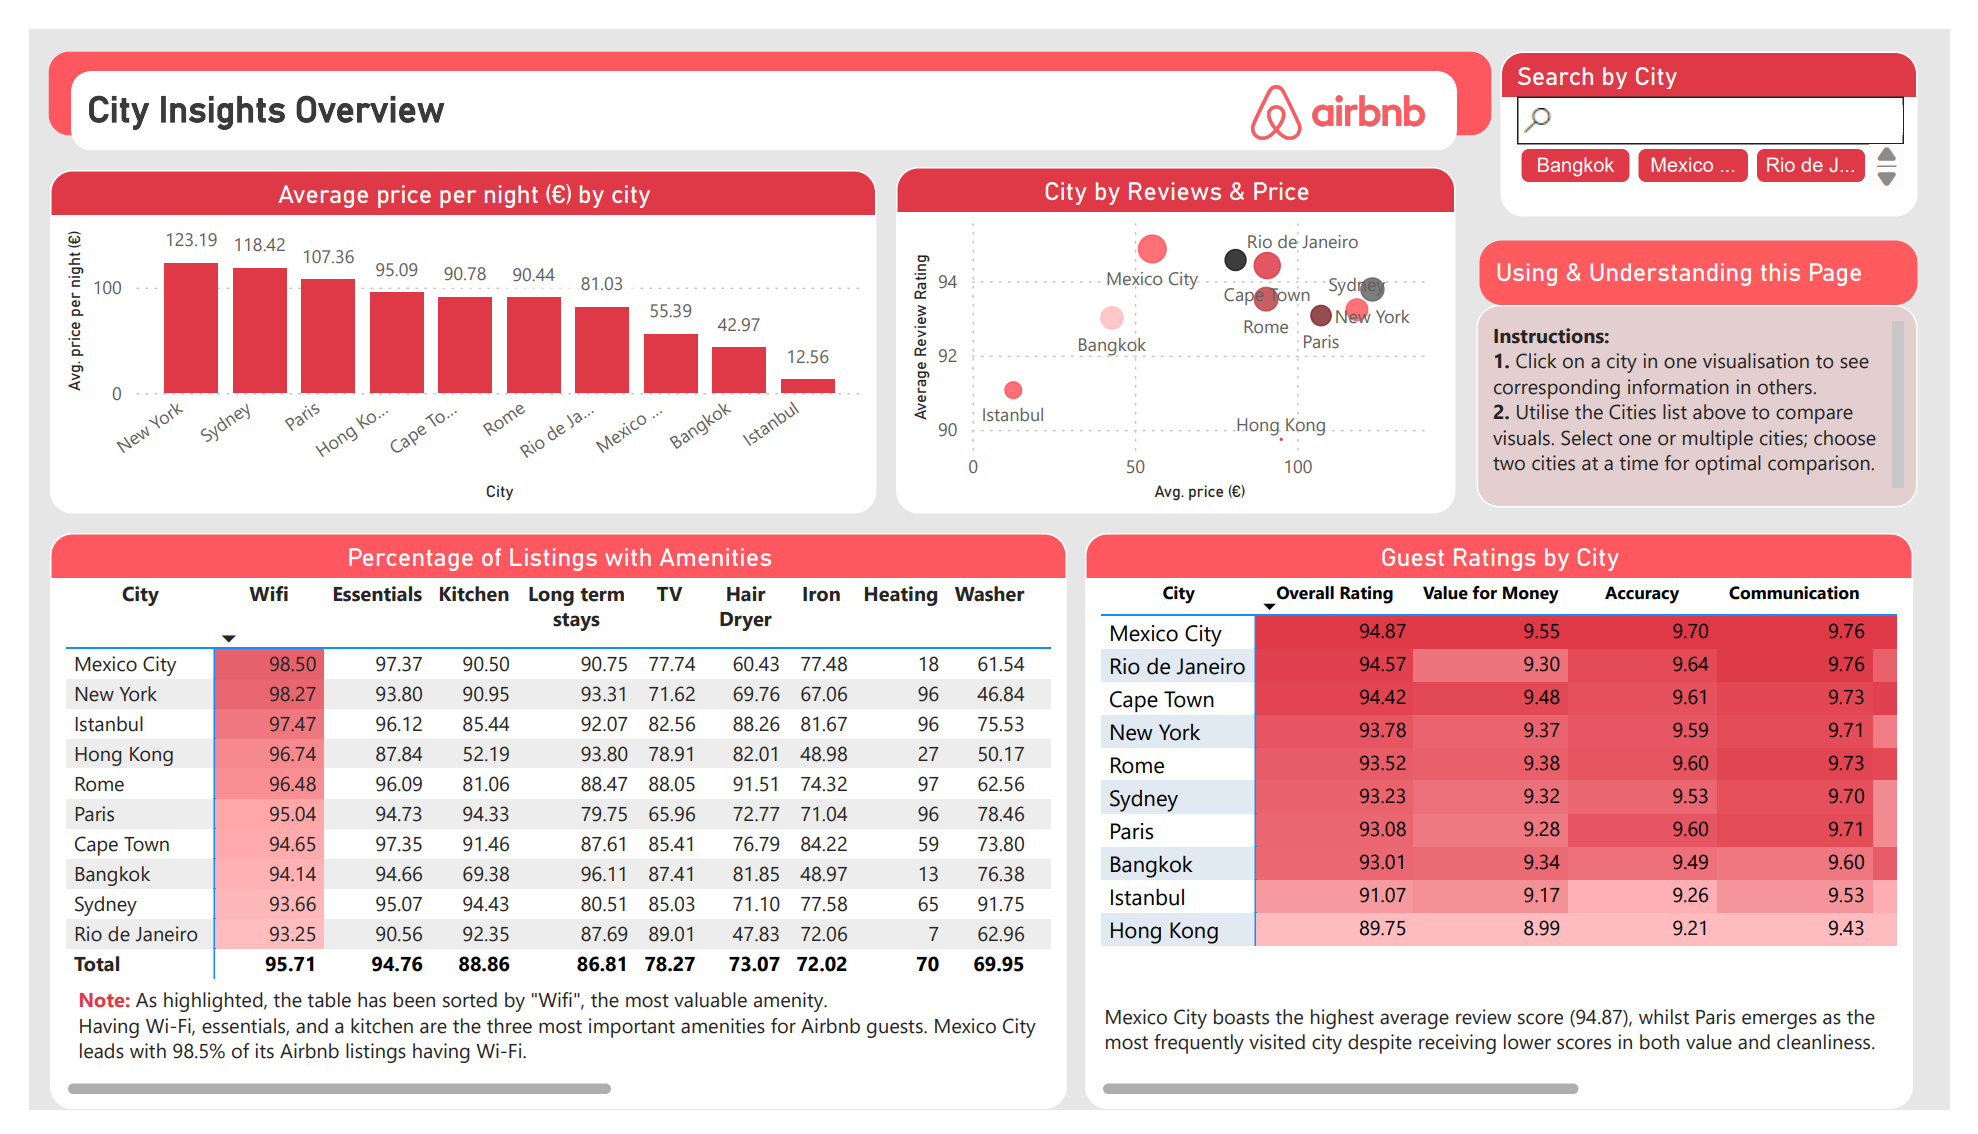
Interactive Power BII completed this report as part of a group project. We wanted to compare the prices of Airbnb properties in 10 major cities around the world and investigate what factors affect the price. This information could be useful to both Airbnb guests and hosts. We found that visualising the data within Power BI was very beneficial, as it allowed us to reach conclusions that would have been much harder to find if just dealing with raw data. The interactivity of Power BI was especially helpful because you can easily compare 2 or more cities.
Interesting Findings
We found some interesting insights from this visualization project. We found that in some cites, like Cape Town and Hong Kong, after a certain number of guests, it becomes cheaper to get a larger property that accommodates an odd number of guests. We also found which amenities are most popular in different cities, which would help hosts when setting up their listings and choosing a price. We found that prices tend to be lower in cities that only started using Airbnb more recently, possibly due to a lack of trust in the new service.